Blog
May 18, 2021
Enterprises looking to decrease downtime and optimize resources can implement server monitoring using tools like Prometheus & Grafana.
Table of Contents
- What Is Server Monitoring?
- Why Monitor Your Servers?
- What Is Prometheus Monitoring?
- What Is Grafana?
- What Are Grafana Dashboards?
- Choose Tools That Support Your Goals
- Why Prometheus Monitoring and Grafana Dashboards?
- How to Implement Prometheus Monitoring For Helix Core
- Grafana Dashboards Examples
- Using Grafana Dashboards to Investigate Possible Problems
- Understanding Root Causes
- Server Monitoring For Future Development
What Is Server Monitoring?
Server monitoring is a way to look into what your servers are doing in real time.
It can provide you with actionable data, and is most often used for troubleshooting and capacity planning. It’s typically done at three levels:
- Network (e.g., traffic, bandwidth, latency).
- Machine (e.g., CPU and memory utilization and storage).
- Application (e.g., rate of user commands, locks, large syncs, commits/submits, etc.).
Why Monitor Your Servers?
Server monitoring has a lot of benefits. The biggest benefit is avoiding reactive panics. You can get a head start on issues occurring in your servers or applications before your users are impacted. Along with this benefit, you can also use monitoring to figure out how to:
- Increase uptime.
- Improve hardware and software performance.
- Plan for the future by making the best use of your resources.
Implementing monitoring can give you an almost immediate return on investment. You can observe trends, spikes, and anomalies that may indicate a problem. And then you can drill down to discover the root cause of the issue.
Back to topWhat Is Prometheus Monitoring?
Back to topPrometheus is an open source system that collects and manages server and application metrics. It can also be configured to notify your team when an issue arises.
What Is Grafana?
Back to topGrafana is an open source tool that allows you to easily visualize information.
What Are Grafana Dashboards?
Back to topGrafana dashboards take information from server monitoring tool like Prometheus to display this information.
Choose Tools That Support Your Goals
Version control is a fundamental building block. It is the foundation for all forms of development. This includes software, chip design, embedded software, virtual reality, game development, and more.
Helix Core is the go-to version control system to manage teams at a massive scale. It allows developers to move faster by handling thousands of users, millions of daily transactions, and terabytes of data. It can easily be deployed in the cloud, or managed on-premises.
But to get the most out of Helix Core, you need to implement monitoring. This helps you achieve appropriate service level agreements (SLAs ). It can help determine how and where you might need additional resources. And for your admin team, it reduces stress and can even improve sleep. Well, maybe the last part might be an exaggeration!
Server Monitoring Combo
Monitoring requires continuously collecting metrics and logs (server and application logs). Metrics come from analyzing these logs and from examining application and operating system counters and attributes on a regular basis. These can be analyzed and graphed to show real time trends in your system.
For this blog, we are going to show you how to implement a combination of Prometheus monitoring and Grafana dashboards for monitoring Helix Core.
Back to topNew in the 2021.1 release, Helix Core Server now includes some real-time metrics which can be collected and analyzed using Prometheus & Grafana alongside the other metrics already being collected with p4prometheus.
Why Prometheus Monitoring and Grafana Dashboards?
Of course there are several other tools on the market. Plus many have integrations for Helix Core. We choose this combo because both of these tools are widely adopted and are open source. They can be easily deployed with little effort for basic installations. They also have enterprise level support, if required. This is a critical differentiator for our customers that need to scale.
How Helix Core Works With Prometheus + Grafana

Prometheus pulls metrics from targets such as node_exporter (distributed as part of Prometheus). It stores the data in its internal time series database. These metrics are generated by p4prometheus and node_exporter by querying the operating system directly.
Back to topHow to Implement Prometheus Monitoring For Helix Core
We have three custom components which interface with Prometheus to export metrics on a regular basis. These are contained in the P4Prometheus repository, available on GitHub.
One component (p4prometheus itself) performs real-time analysis of Helix Core server logs, writing updated metrics typically every 30 seconds.
The second component (monitor_metrics.sh) runs regular p4 reporting commands. It analyzes the results and creates metrics on a regular basis. It has been updated to also collect the new real-time metrics from a 2021.1 or later Helix Core Server and include those in the overall information.
Then there is a third component (monitor_metrics.py and monitor_wrapper.sh) which uses the Linux lslocks utility to regularly analyze server locks and record them, as well as writing metrics.
They feed data into Prometheus via its node_exporter component, and that data can then be made visible on Grafana dashboards. As shown in the diagram above, you can also set up custom alerts to your team via Slack, email, or even phone/text notifications.
How to Set Up Prometheus and Grafana on Helix Core
- Install Prometheus and Grafana on a separate VM/machine to your Helix Core server. This is a best practice for security and high-availability reasons. We recommend also installing Victoria Metrics which is a Prometheus-compatible long-term storage system which provides better performance and reduced data size.
- The GitHub repo includes detailed manual instructions to install the various components. It also has a couple of scripts to automate the installation on Linux (CentOS and Ubuntu). Review installation instructions for more information.
- On your commit and any replica/edge servers, you need to install node_exporter and p4prometheus with monitor_metrics.sh to gather metrics.
- On your monitoring server, you can install Prometheus, Victoria Metrics, Grafana, and configure Prometheus to gather the metrics from your other servers.
- Optionally you may install alertmanager or other integrations to perform automated alerting and similar notifications.
- Once installed you can set up your Grafana dashboards as documented. Examples include:
- Commands summary.
- Command durations and counts.
- Active commands.
- Replication status.
- Learn more about configuring Grafana >>
Grafana Dashboards Examples
Here are some Grafana dashboard examples that indicate normal usage.
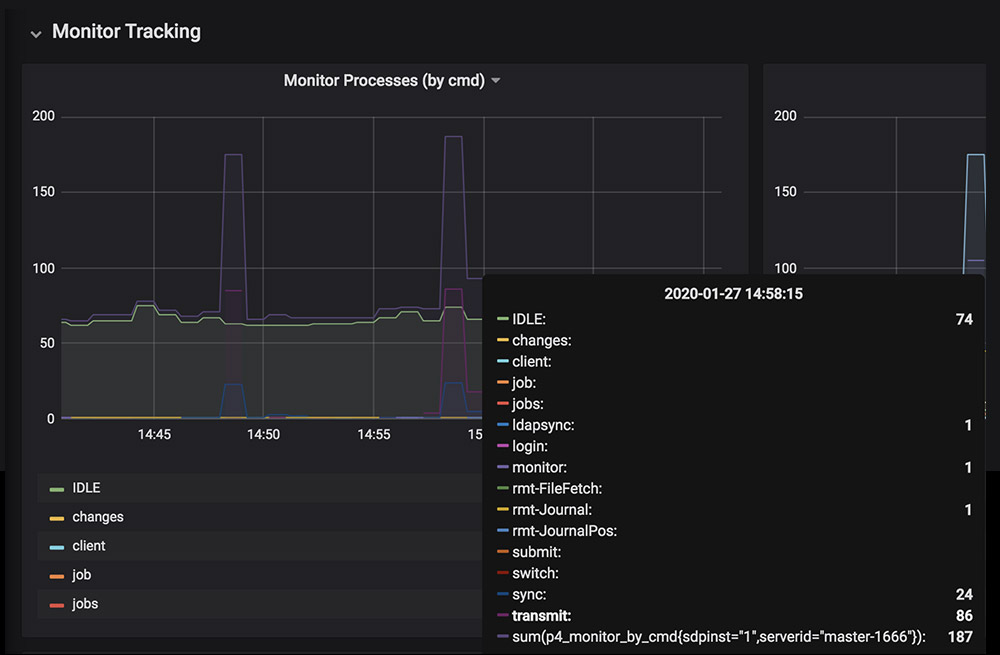
In this example, there are a couple of minor spikes that are due to sync commands. When parallel syncs are in use, you can see “transmit” commands. It is common to have regular small spikes in many organizations, particularly when automated build farms kick off.
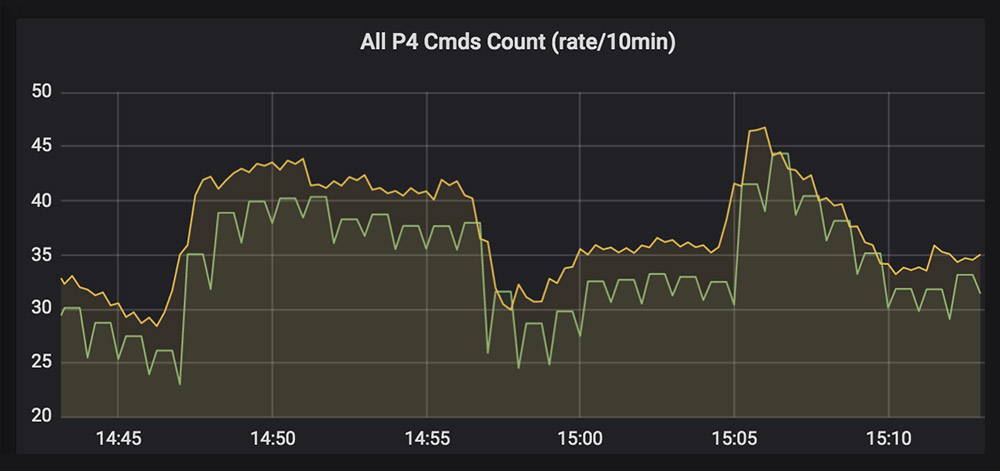
In this example, you can see the rate of commands being executed against the server every ten minutes.
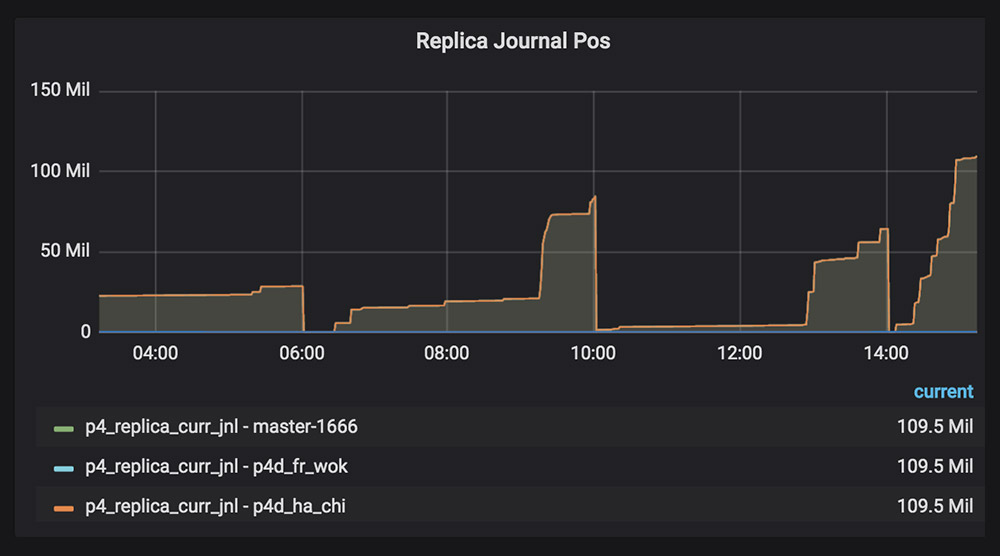
In this example, we see the replication status. The master and two replicas are continuously in sync, and the replication is not lagging behind.
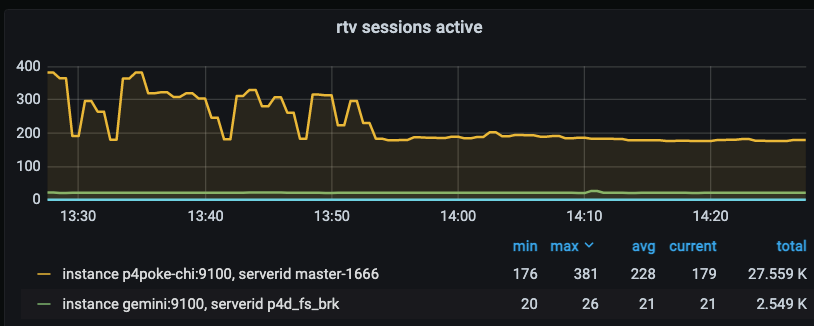
This example shows one of the new real-time metrics from 2021.1 - it is a useful cross check with other existing metrics.
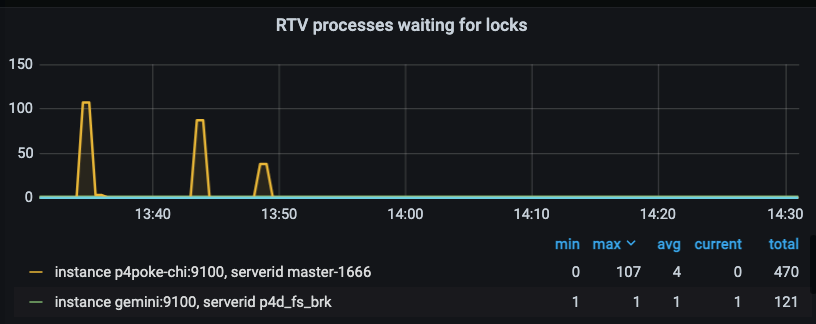
Another real-time metrics example showing a count of processes waiting for locks.
Back to topUsing Grafana Dashboards to Investigate Possible Problems
When you see a spike or dip in usage, it may indicate a larger issue. When we look at the command usage, we can see a dramatic spike that it is out of the ordinary.
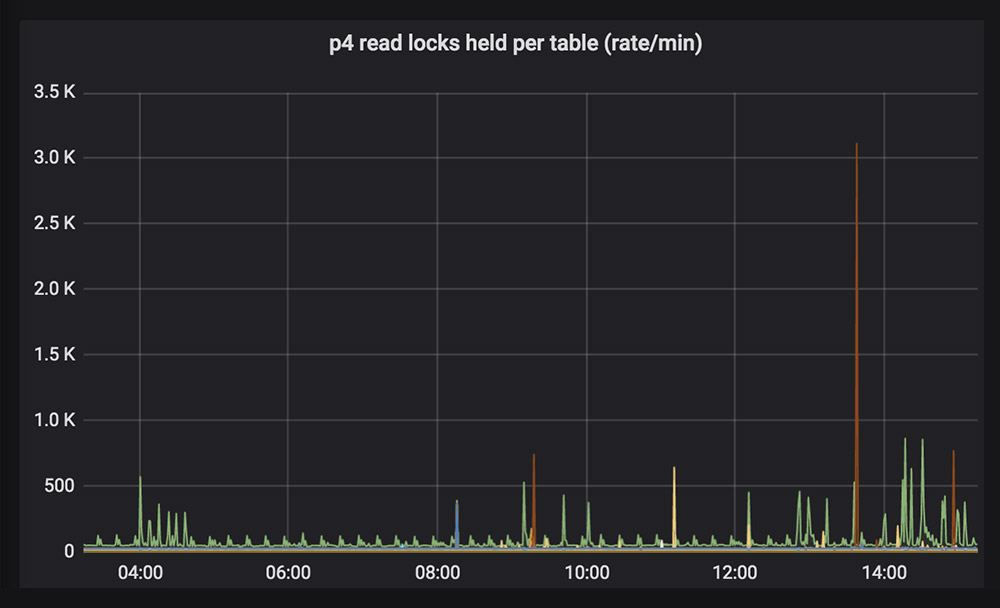
To zoom in on the spike, simply click and drag over a small time period to see which table is involved.
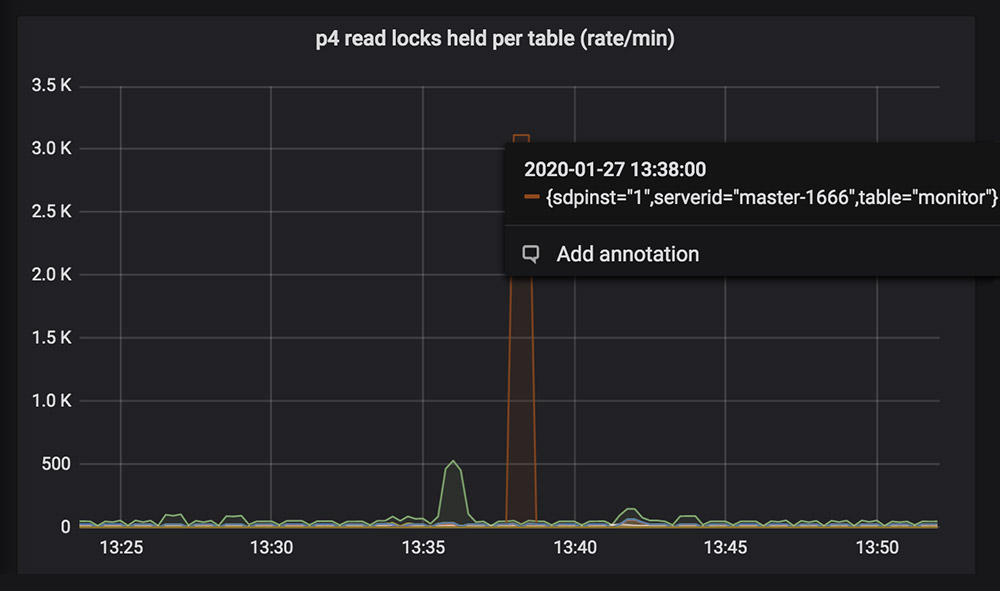
In this instance, it is not concerning because it involves the monitor table over a short period of time . If it was a different table or if it the spike continued over a longer time, it might indicate that something should be investigated further.
Back to topUnderstanding Root Causes
Monitoring can show you a spike or a trend. But what it doesn’t necessarily tell you is why something is occurring. To find out, you would typically look in the logs to see what commands are being executed and by whom. Or you might examine the server load or network status using standard operating system commands.
You can search through Helix Core logs on the server. They are either in text file format, CSV, or both. Or there are several applications that can be used to aid in this investigation. For example, applications such as Elastic Stack, Splunk, Greylog, Datadog, New Relic, and more can fully index your logs and make them faster to search through. They provide powerful query and analysis options. Some even come with their own dashboards.
Challenges Managing Helix Core Logs
Logs contain a lot of information that helps analyze problems. The downside is that logs can be quite large. You need to prune logs and determine how long to keep them around. If you are not careful, this can create another, potentially expensive, problem. You do not want to spend resources storing logs that no one looks at!
We have sample modules for integrating Helix Core with Elastic Stack for real-time log analysis, and plenty of our customers have integrations with other log analysis tools.
Back to topServer Monitoring For Future Development
Implementing server monitoring is a vital step towards scaling your infrastructure. You can quickly determine where you need to add more resources, and it gives you what every business decision needs more of –– time.
Set up your teams for success with Helix Core + Prometheus monitoring + Grafana dashboards.
Not a Helix Core customer yet?
