Turn Insights Into Graphics With Perforce PV-WAVE
Data means nothing without the ability to analyze it efficiently and accurately. Use Perforce PV-WAVE to meet your data analysis requirements efficiently and accurately. With this visual data analysis tool, you can rapidly import, manipulate, analyze, and visualize data.
By using Perforce PV-WAVE, you can turn insights and data into meaningful graphics by rapidly importing, analyzing, manipulating, and visualizing large datasets. You can manipulate and visualize complex or extremely large technical datasets to detect and display patterns, trends, anomalies, or other vital information. Plus, you can quickly import, manipulate, and interpret your data visually in an easy-to-use framework.
Advantages include:
- Realize opportunities
- Reduce time to results
- Accelerate development
- Illustrate knowledge from data
What Is Perforce PV-WAVE?
Perforce PV-WAVE is an array-oriented programming language with a rich set of analysis routines (based on IMSL Numerical Libraries). It’s used by engineers, scientists, researchers, business analysts, and software developers to build and deploy visual data analysis (VDA) applications.
Perforce PV-WAVE can help you:
- Manipulate and visualize data sets of varying complexity.
- Detect and display patterns, trends, anomalies, and other vital information.
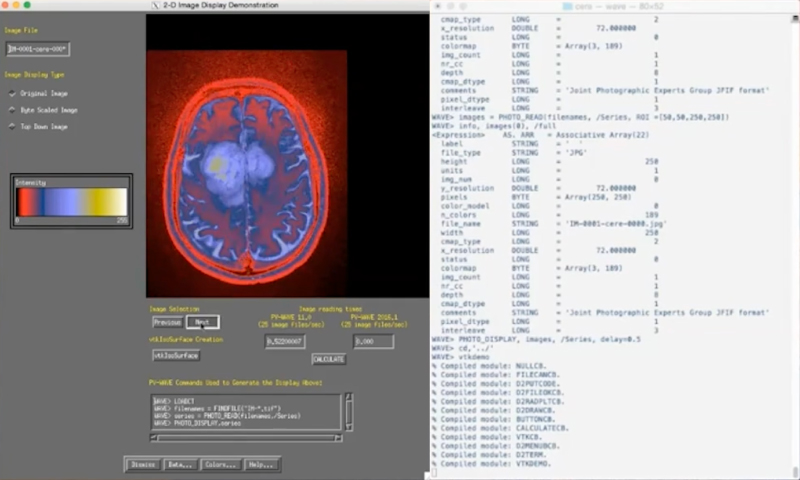
- Deliver powerful image and signal processing, data import and export, 3D surface, plot, histogram, contour, animation, color editor, and a database table display.
- Incorporate sophisticated analysis routines based on the industry-standard IMSL Numerical Libraries for reliable and precise numerical analysis.
Key Features of Visual Data Analysis Tool
Extensible 4GL
Interactive Commands
Restoration & Support
Complete Set of Data Types
Multi-Dimensional Arrays
Subscription Options
Comprehensive Utilities
World-Class Support
Array-Enabled Operators
Array-Enabled Common Functions
Array-Enabled Special Functions
Tensor Functions
Filters
Linear Systems
Nonlinear Equations
Transforms
Quadrature
Differential Equations
Optimization
Interpolation & Approximation
Regression
Basic Statistics
Analysis Features
Time Series & Forecasting
Probability Features
Plotting
Basic Image Processing
Polygonal Rendering
Volume Rendering
Mapping
Annotation
Additional Graphics Features
Data Import/Export
Image Format Support
Open Architecture
GUI Development
Visual Digital Analysis Tools
Get Started With Perforce PV-WAVE
Fill out the form to speak with an expert about how Perforce PV-WAVE can help your business meet its data analysis requirements quickly and accurately.

